This web page was produced as an assignment for Genetics677, an undergraduate course at UW-Madison.
Microarray
Following data and figure retrieved from GEO (Gene Expression Omnibus)
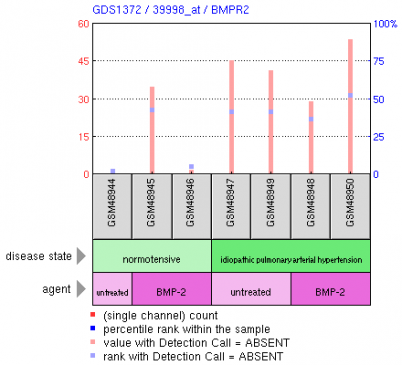
This data (GEO accession: GDS 1372) is a analysis of pulmonary arterial smooth muscle cell proliferation in normotensive and idiopathic pulmonay arterial hypertension (Fantozi et al 2005). I coudn't find any comparison with familiar pulmonary arterial hypertension, I decided to use this microarray to understand the smooth muscle cell proliferation. As it is shown, there are more number of smooth muscle cells in the diseased states.
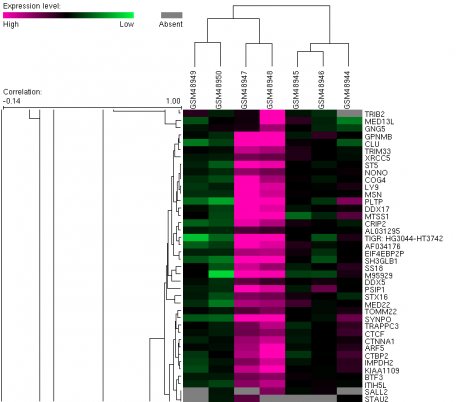
I couldn't find a perfect region that includes imporatant gene expression, such as BMPR2, Smad 1, Smad2, or other signgliang proteins. Because there are so many gene expressions are involved with, it was hard to select a good region. Therefore, I just selected that represent well on distinction between low and high expression. Maybe those genes are important to consider for my further analysis.
Reference
[1] Divergent effects of BMP-2 on gene expression in pulmonary artery smooth muscle cells from normal subjects and patients with idiopathic pulmonary arterial hypertension. Exp Lung Res 2005 Oct;31(8):783-806.
[1] Divergent effects of BMP-2 on gene expression in pulmonary artery smooth muscle cells from normal subjects and patients with idiopathic pulmonary arterial hypertension. Exp Lung Res 2005 Oct;31(8):783-806.
